Original Research
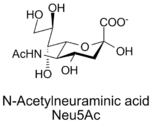
Another surface cell marker that is common to many mammalian cells is a glycoprotein known as sialic acid, also known as N-Acetylneuraminic acid.
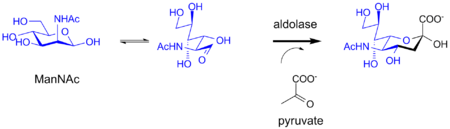
Sialic Acid is a nine carbon monosaccharide synthesized by the aldolase enzyme. A molecule known as mannose is combined with a three carbon pyruvate to form sialic acid. The structure of sialic acid and the reaction used to synthesize it or shown below.
 |  |
Sialic acid plays a large role in the spread of disease within the human body. For example, metastatic cancer cells often express sialic acid in large amounts, creating a negative charge on the surface. This means that the cancer cells are repulsed by each other, encouraging the spread of late-stage cancer throughout the body by means of the blood vessels. In addition, sialic acid allows increased infection by influenza. The influenza viruses have been found to bind to the sialic acid molecules found on red blood cells and on the cells in the upper respiratory tract. Thus, sialic acid is the means by which this virus gains access to the human body.
As part of multiple disease processes, sialic acid offers a logical choice for further examination and scrutiny.
I am currently working in an UCD lab on a project in which the structure of the enzyme aldolase, which synthesizes Sialic Acid, is being analyzed when it binds to a mutated form of the substrate (sialic acid). The structure of the original protein was already derived through X-ray crystallography. Since aldolase is an enzyme, and can stimulate both the forward and backward reactions, the sialic acid bonds to it. However, the sialic acid, once it has undergone the chemical reaction is released. Thus, the bonds between the enzyme and the substrate were unable to be studied. As such, I am working with a mutated form of sialic acid, that will bond to the enzyme with undergoing the chemical reaction with the goal to analyze the bonds.
The steps to deriving the structure of the enzyme and bonds are as follows:
First, the protein needs to be harvested. This was done by growing up a colony of bacteria that had been transformed with a gene containing both ampicillin resistance and the gene of interest, the gene that codes for aldolase.
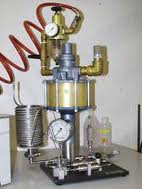 | Fortunately, the gene expresses quite well and so a large quantity of the desired protein was easily harvested. Next, the cells containing the protein were lysed open to release the aldolase contained within. To the right is a picture of a microfluidizer, a machine that lyses open cells by pressure rather than heat or chemicals, such that the proteins and nucleic acids within are no denatured. |
The next step was to purify the protein. At this stage, a device called a column was used. First, the solution containing the protein was poured through the column, where several types of proteins bound to the beads or resin. A solution called wash buffer ran through after, releasing the bonds between the non-specifally bound proteins and the beads. A final elute buffer released the purified protein as well.
To the right is a diagram demonstrating how a column works. The picture shows the point at which a wash buffer has been added. The green triangles represents the protein of interest, and the other shapes are non-specific proteins whose bonds have been broken by the wash buffer. |  |
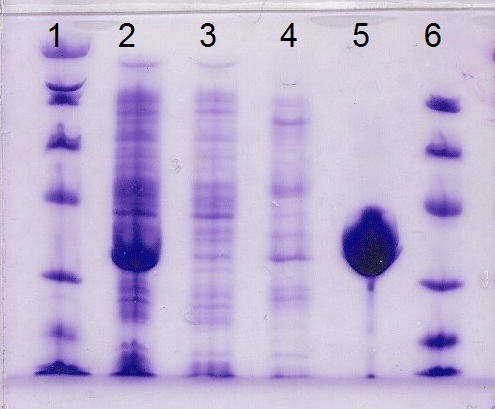 | Afterwards, a gel was run to ensure that the protein had purified properly. In the picture to the right, the two outer columns, numbers 1 and 6, are ladders in terms of Daltons to gauge how large the other proteins are. The larger the protein, the slower it migrates from the top of the gel down when introduced to an electric current and field. The second column is the supernatum that I collected after centrifuging the lysed cells,including the molecules soluble in water. The third column is the flow through, the fourth is the wash buffer, and the fifth is the elute buffer, which contained the sialic acid. The protein is in a large clump rather than in neat tight rows because the gel was overloaded, meaning that the protein was present in high concentrations in the solution harvested from the bacteria cells. |
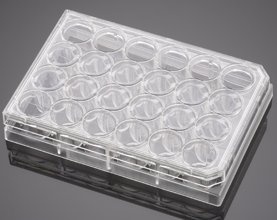
The next step was to attempt to crystallize the protein, such that X-ray crystallography could be used. At this stage, a well plate was used. A picture of this is below.
Various conditions were experimented with. Isopropanol and 2-propanol were used, each at different concentrations. Higher concentrations in general yielded higher amounts of precipitation, and also affected the likelihood of crystals forming.
In addition, multiple different kinds of buffers were used in order to utilize different pH's as this had a large effect on whether the crystal would form or not. Some buffers used include Imidizole, Tris, Sodium Phosphate and Citric acid, some of which were at multiple pH's.
Finally, because no crystals were succesfully synthesized, different additives and detergents were used. These included, Beta-OG Thi, Beta- OG, SDS, WP-40, Triton, TCEP, and PEG 400.
After many fruitless attempts, crystals were successfully formed. The conditions at which the crystals formed are described below, along with a picture of the crystal.
The buffer was Tris at a pH of 8.00 but at a lower concentration than normal. PEG-400 was added as an additive. Isopropanol was used at a concentration of 23%. The crystals formed were in the shape of diamonds. 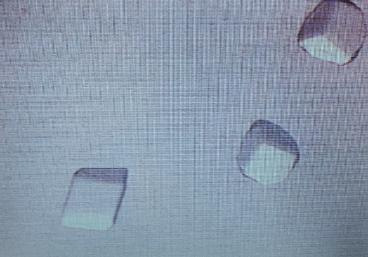 | 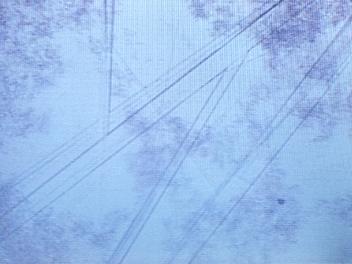 The buffer used was a solution of Sodium Phosphate and Citric Acid at a pH of 4.5. The detergent Triton was added and crystals formed at a range of 17-23%. Unlike the other crystals, these were long and slender, representing pencil crystals. |
Using these crystals, I gathered data on the diffraction patterns of x-rays when shot through the crystal. This data was used to create an electron density map of the enzyme and the substrate. However, I discovered that the substrate was not properly binding to the enzyme, resulting in disjoint models where there should have been continuous electron densities.
It was deduced after examining the components of the buffer, the detergent and the precipitating agent, that the calcium ions were precipitating the sialic acid out of the solution. In order to fix this, I soaked the crystals in a solution with very low concentrations of calcium and high concentrations of sialic acid in order to dilute the calcium and force the sialic acid to bind.
To the right is a picture of the diffraction pattern gathered from one crystal. This particular crystal was grown in sodium cacodylate and then soaked with 10 mM calcium and 40 mM Sialic Acid. | 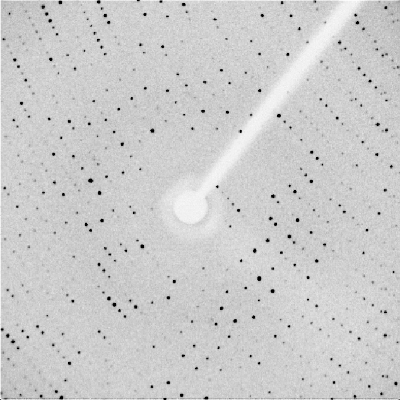 |
Currently, I am working with a different set of conditions in order to achieve better results. I am using sodium cacodylate, a derivative of arsenic, as a buffer and iso-proponal and PEG-400 as an additive.
I have been working in the lab since January 2012, and have been working there for a year. I plan on continuing this research this year.